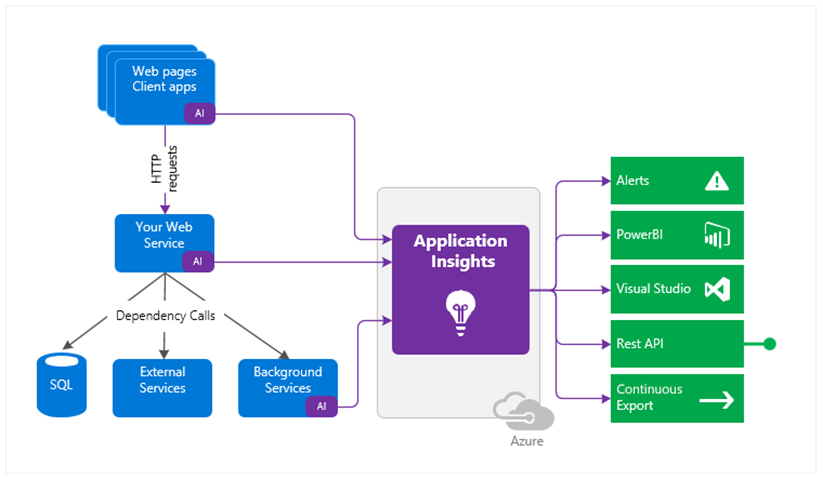
Finding out about performance issues and collecting metrics on the usage of your app is important. Add Application Insights to your apps and let the reports tell you what is wrong and allow you to track all kinds of dimensions.
Microsoft provides several SDK’s for this, for all types of frameworks and languages. In this post, we will look at how to set this up for a typical Java (Spring Boot) API and an Angular Single Page Application. Although you can easily monitor each component separately, we also show how to enable distributed telemetry correlation. This allows you to aggegrate frontend and backend metrics in a single query, see next section!
Correlation
A special note on correlation. From the docs:
Application Insights defines a data model for distributed telemetry correlation. To associate telemetry with a logical operation, every telemetry item has a context field called operation_Id. This identifier is shared by every telemetry item in the distributed trace. So even if you lose telemetry from a single layer, you can still associate telemetry reported by other components.
A distributed logical operation typically consists of a set of smaller operations that are requests processed by one of the components. These operations are defined by request telemetry. Every request telemetry item has its own id that identifies it uniquely and globally. And all telemetry items (such as traces and exceptions) that are associated with the request should set the operation_parentId to the value of the request id.
This means, that if you enable distributed tracing correctly, you should always be able to correlate telemetry from different sources and to navigate from a distributed logical operation to the individual operations. This is going to save us a lot of time, no more plowing through logfiles!
Our sample scenario
Our scenario is pretty straightforward: an Angular frontend application that connects to a Spring Boot REST backend application. Although we do not include any backend microservices or other complex parts, it is still considered a distributed environment. The approach we are going to use can easily be extended to more complex architectures.
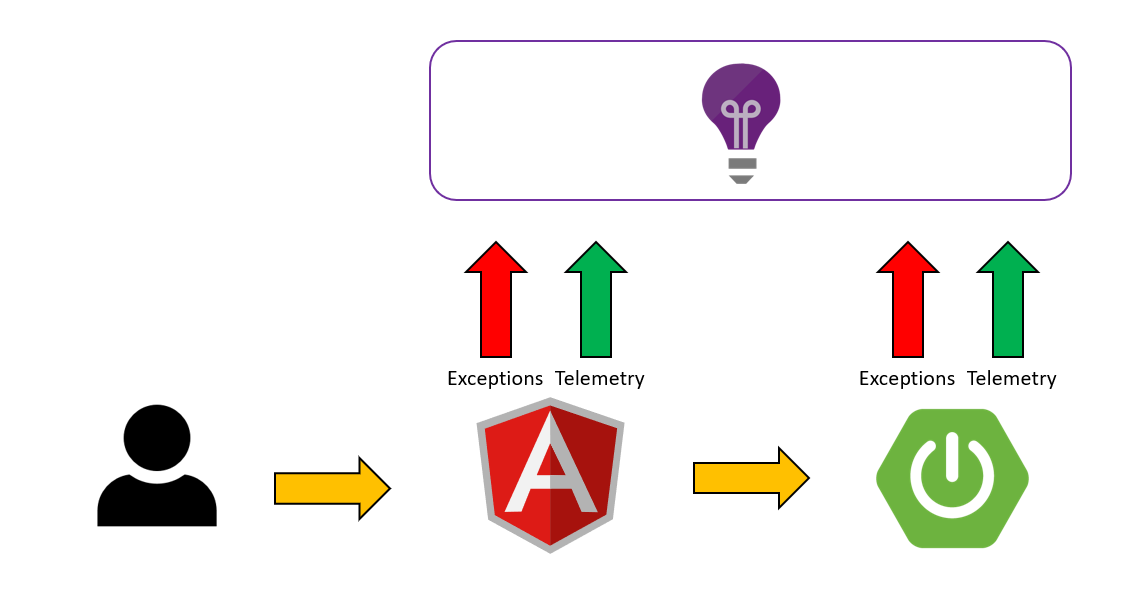
So we want to send both exceptions and telemetry to Application Insights.
The app
Starting with the Angular app, we need to add the Javascript SDK. You can just follow the instructions from the GitHub guide: https://github.com/microsoft/ApplicationInsights-JS but for our sample app the instructions are:
- Add the library: npm i –save @microsoft/applicationinsights-web
- Add the instrumentation key from Azure Application Insights to the config file /assets/config/config.develop.json
- configure the distributed tracing mode
- set the cloud role tag
Since this is a Single Page App, it relies on Angular routing for the navigation. To be able to pickup the route changes, the Application Insights integration is done with the help of a service that subscribes to the routers ResolveEnd event:
private appInsights = new ApplicationInsights({
    config: {
      instrumentationKey: AppConfig.settings.instrumentation,
      distributedTracingMode: DistributedTracingModes.W3C,
      disableCorrelationHeaders: false,
      enableCorsCorrelation: true
    }
  });

constructor(private router: Router) {
    this.appInsights.loadAppInsights();

    this.appInsights.addTelemetryInitializer(envelope => {
      envelope.tags\["ai.cloud.role"\] = "app";
    });

    this.router.events
      .pipe(filter(event => event instanceof ResolveEnd))
      .subscribe((event: ResolveEnd) => {
        const activatedComponent = this.getActivatedComponent(event.state.root);
        if (activatedComponent) {
          this.trackPageView(
            \`${activatedComponent.name} ${this.getRouteTemplate(
              event.state.root
            )}\`,
            event.urlAfterRedirects
          );
          this.appInsights.flush(); // Debug -> don't wait for browser to close
        }
      });
  }
Full source code: https://github.com/yuriburger/monitoring-demo-app
A couple of notes on this:
- This code subscribes to the ResolveEnd event and uses some private methods to get the activated component and path that was used to match (see this blogpost https://dev.to/azure/using-azure-application-insights-with-angular-5-7-4kej for more information)
- The distributed tracing method is set to W3C. The Applications Insights team is switching from the MS specific format (AI) to the more standardized W3C Trace Context ( more info on this https://docs.microsoft.com/en-us/azure/azure-monitor/app/correlation#correlation-headers )
- The Instrumentation Key is gathered from the configuration service, please see the full source code for more info on this.
- Normally the App Insights data is sent to MS when the browser closes. We added the appInsights.flush() to do this on every route change.
The backend
The backend is based on a simple Sprint Boot application with a REST controller. In the dependencies we enable Application Insights with the help of a starter:
<dependency>
  <groupId>com.microsoft.azure</groupId>
  <artifactId>applicationinsights-spring-boot-starter</artifactId>
  <version>2.5.1</version>
</dependency>
Set the correct properties:
azure.application-insights.instrumentation-key=#{INSTRUMENTATION\_KEY}#
spring.application.name=api

#Enable W3C distributed tracing support for Java apps
azure.application-insights.web.enable-W3C=true
azure.application-insights.web.enable-W3C-backcompat-mode=false
And we enable some telemetry in one of the Controller classes:
@RestController
@CrossOrigin(origins = "\*")
@RequestMapping(path = "/info")
public class InfoController {
    @Autowired
    TelemetryClient telemetryClient;

    @GetMapping(path = "", produces = "application/json")
    public ResponseEntity<Object> getInfo() {
        telemetryClient.trackEvent("Info requested...");
        return new ResponseEntity<>("{\\"version\\": \\"1.0\\"}", HttpStatus.OK);
    }
}
Full source code: https://github.com/yuriburger/monitoring-demo-api
Notes:
- Update the properties file to include the correct Instrumentation Key (/src/main/resources/application.properties)
- We send some custom data to App Insights with the trackEvent, but we can add other metrics as well
- We distributed tracing method is set to W3C without compatibility (see https://docs.microsoft.com/en-us/azure/azure-monitor/app/correlation#correlation-headers for more info)
The result
When we run the app and the backend, logs should accumulate in Application Insights. You need to give it a few minutes, but this should be the result:
(requests
| union dependencies
| union pageViews
| union customEvents)
| where operation\_Id == "76ee5b17521b4635b0f745f2993fa60d"
| project timestamp, itemType, name, id, operation\_ParentId, operation\_Id
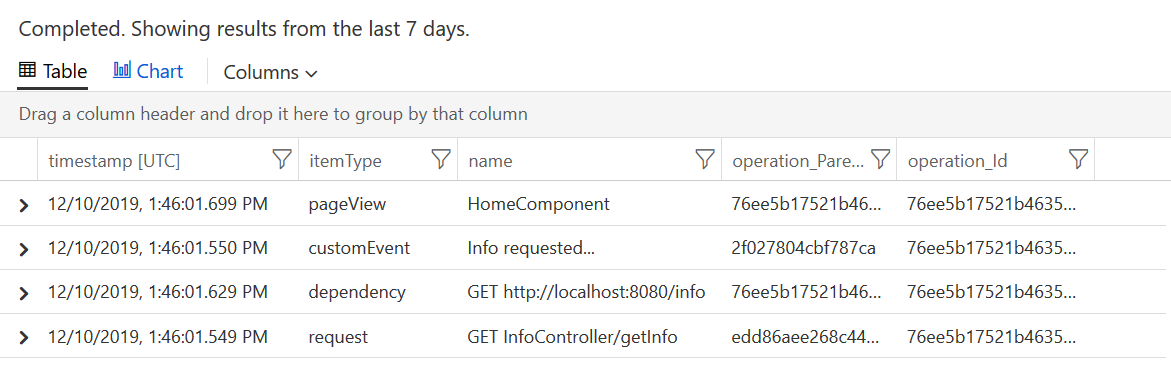
If we now query on operation_Id, we should get all the info in one result:
- The pageView is from the Angular app, specifically the routing event.
- The dependency is from the “microsoft/applicationinsights-web” npm package, it auto-collected the outgoing XHR request.
- Request is coming from the Spring Boot metrics, also auto-collected and correlated using the W3C tracing headers.
- The Custom Event is from the InfoController in Spring Boot.
/Y.